

The number of exits of portfolio startups is one of the core metrics of a venture fund. To generate revenue for their LPs and attract investors in the future, VCs try to come up with smart and viable investment strategies. It requires finding a balance between portfolio diversification and limited expertise of funds’ partners.
Each fund develops an investment strategy that usually identifies up to 10 key industries the fund is going to focus on. Those key industries are typically the ones in which the partners have the most experience. Their expertise increases a chance of successful exit, as it adds value to portfolio startup founders (smart money concept). Investing in those industries is certainly crucial for a fund's success. Thus, the fund is interested in covering the largest number of sectors possible to assure efficient diversification and reduce risks.
We have observed that some of the most successful funds in history are doing well in combining portfolio diversification strategy with investments in areas of their high expertise. We measured it by comparing the fund’s strategic industries with industries that generated exits with the highest valuation. If the fund achieves sudden success in the industry that is not among its areas of expertise, this success shouldn’t be credited to the fund itself. It may as well be attributed to favorable market conditions, the founder’s genius, or a lucky chance.
Therefore, we came up with an index to measure this metric. We called it «Success/Strategy Similarity Index». This index shows what percentage of the fund’s most successful industries coincide with its strategic ones.
We have calculated this index for each of the funds in our comprehensive and verified database. For this article, we’ve analyzed top funds that have made 50+ investments and had at least 10 exits. Additionally, they were also active during the last year.
Top 20 funds with the highest index
- Accel
- Sequoia Capital
- GV
- Slow Ventures
- Kleiner Perkins
- SeedInvest
- Salesforce Ventures
- Lightspeed Venture Partners
- Silicon Valley Bank
- General Catalyst
- GGV Capital
- Meritech Capital Partners
- ICONIQ Capital
- Silver Lake Partners
- DFJ Growth
- Benchmark
- Redpoint
- SV Angel
- Trinity Ventures
- IVP (Institutional Venture Partners)
Here’s the graph of these funds arranged in descending order:
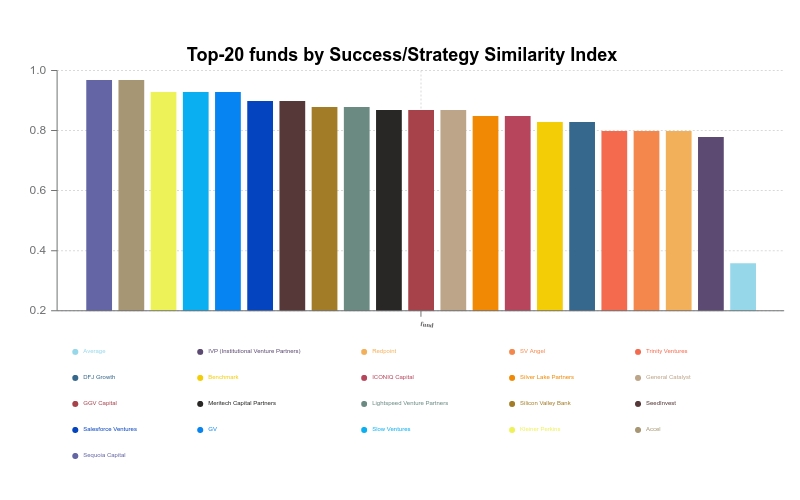
In addition, we have also observed some interesting patterns about these funds:
- All funds are from the USA. 18 out of 20 are headquartered in Silicon Valley.
- In the past 20 years, they have invested in 574 future unicorns. Moreover, 270 of those startups have already exited.
- 55% of those funds invest in seed, 75% — in early-stage, 85% — in late-stage startups.
- Fund employees often mention their key industries in their social media (index of 0.14 in comparison to the average index of 0.07)
- They act as a lead investor in 5% fewer cases than average on the market
- These funds don’t have any preference for a number of founders in a startup. Still, they are less likely to invest in a startup founded by 5 or more people
- In addition, some of these funds have strong syndicate connections. For example, Accel’s most frequent co-investor is Trinity Ventures. Benchmark usually follows Lightspeed Venture Partners.
Although the number of exits is the most common funds' success metric, additional metrics allow a more detailed view of the VC strategies. Their ability to make reasonable bets, ensuring great risk management and potentially high returns is also important.